Consolidated Results Highlights
Financial Data for Past Five Years
-
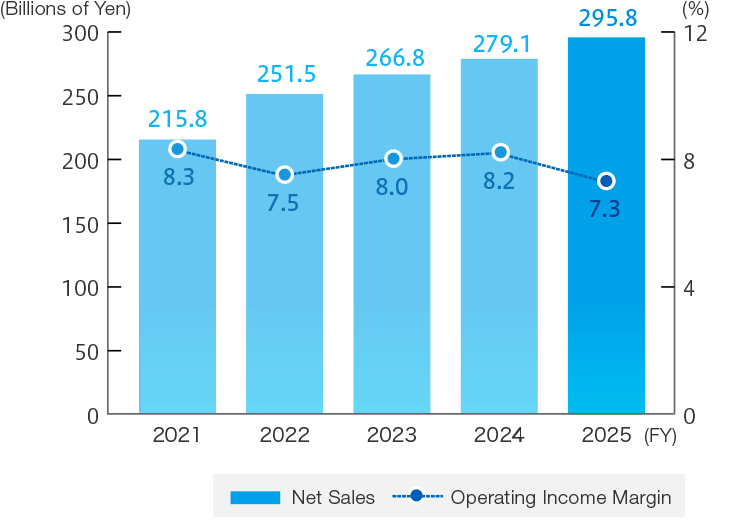
Net Sales and Operating Income Ratio
-
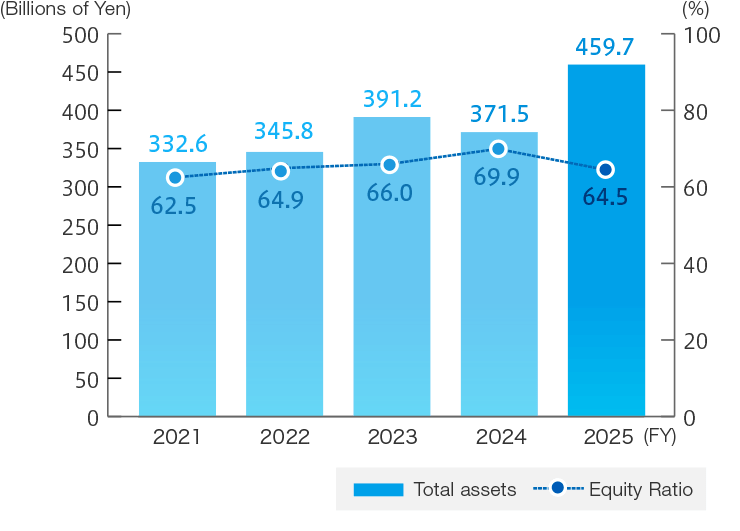
Total Assets and Equity Ratio
-
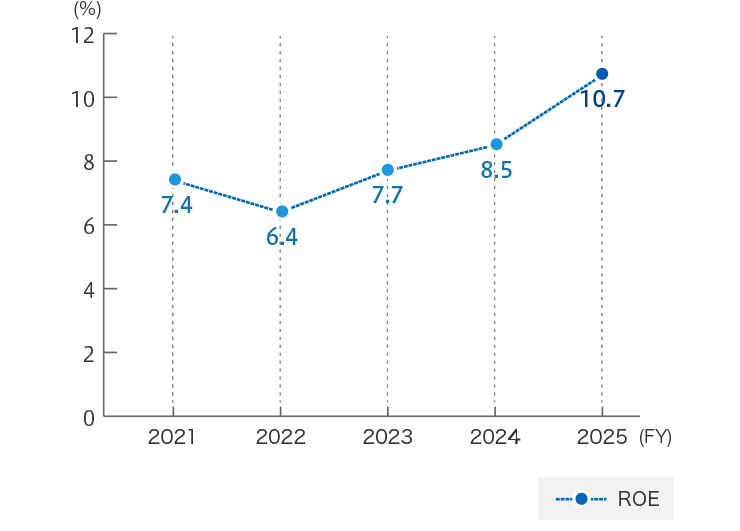
ROE (Return on Equity)
Consolidated Operating Performance
(Millions of yen)
| Fiscal Year | FY 2021 | FY 2022 | FY 2023 | FY 2024 | FY 2025 |
|---|---|---|---|---|---|
| Net sales | 215,879 | 251,574 | 266,812 | 279,193 | 295,878 |
| Operating income | 17,842 | 18,985 | 21,262 | 22,854 | 21,578 |
| Operating income ratio | 8.3% | 7.5% | 8.0% | 8.2% | 7.3% |
| Net income attributable to parent company shareholders | 14,543 | 13,742 | 18,551 | 22,122 | 29,708 |
| Net income per share | 392.88 yen | 371.12 yen | 511.65 yen | 212.65 yen* | 295.80 yen |
| ROE (Return on Equity) | 7.4% | 6.4% | 7.7% | 8.5% | 10.7% |
* Effective October 1, 2024, the Company split its common shares at a ratio of 1 to 3. Profit per share of FY2024 is calculated assuming that such stock split was conducted at the beginning of the this consolidated fiscal year.
Consolidated Balance Sheets
(Millions of yen)
| Fiscal Year | FY 2021 | FY 2022 | FY 2023 | FY 2024 | FY 2025 |
|---|---|---|---|---|---|
| Total assets | 332,620 | 345,878 | 391,298 | 371,510 | 459,784 |
| Net assets | 207,756 | 224,398 | 258,400 | 259,810 | 296,356 |
| Equity ratio | 62.5% | 64.9% | 66.0% | 69.9% | 64.5% |
Results by Segment
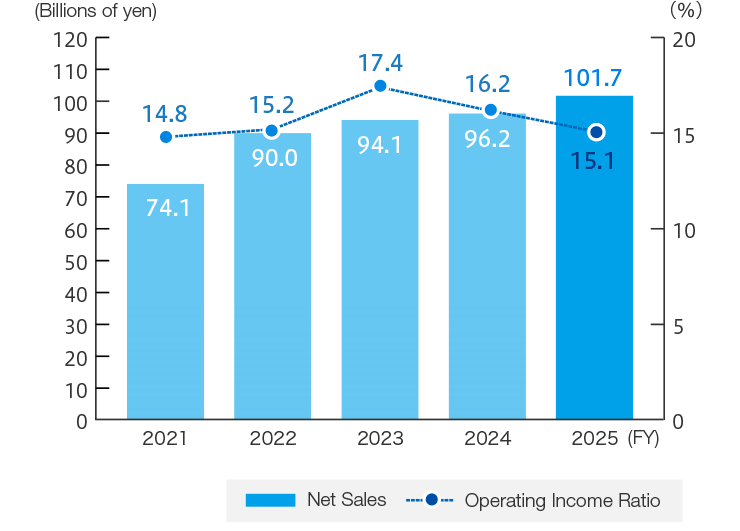
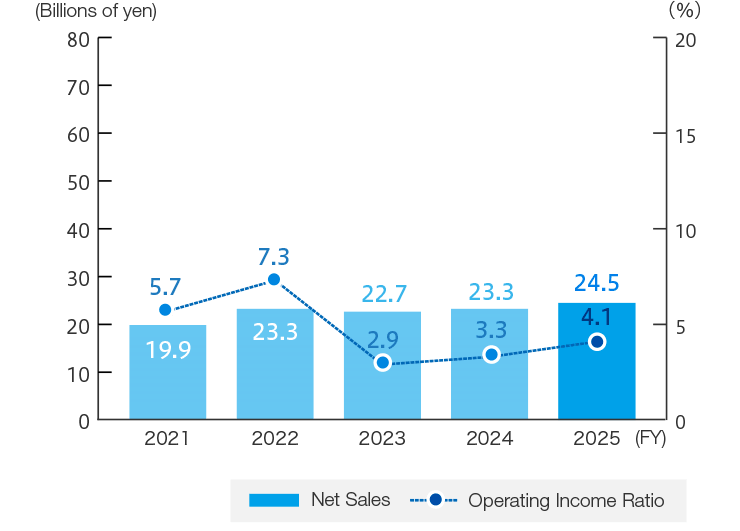
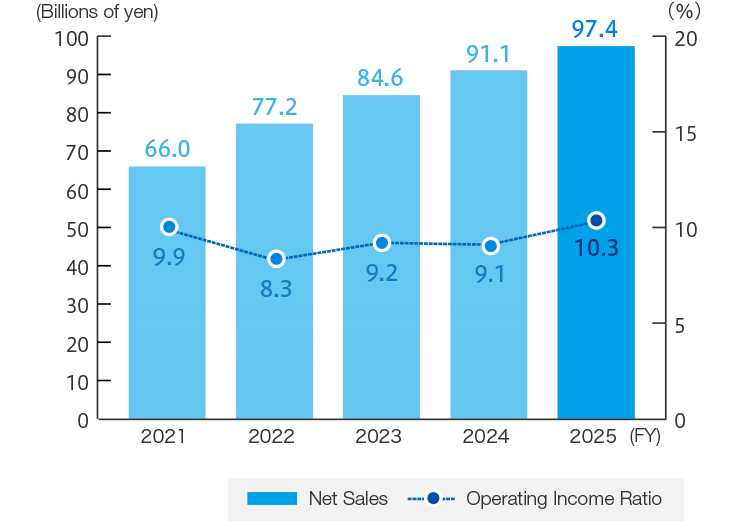
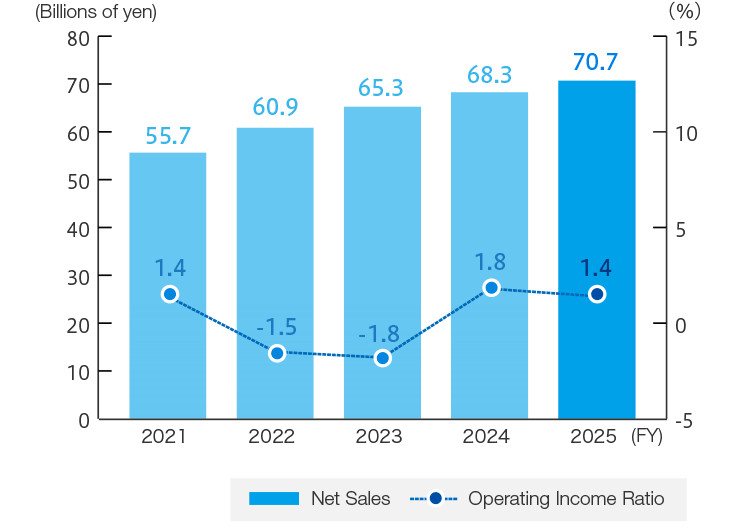
Performance Trends by Business Segment
-
Chain Operations
-
Motion Control Operations
-
Mobility Operations
-
Materials Handling Operations
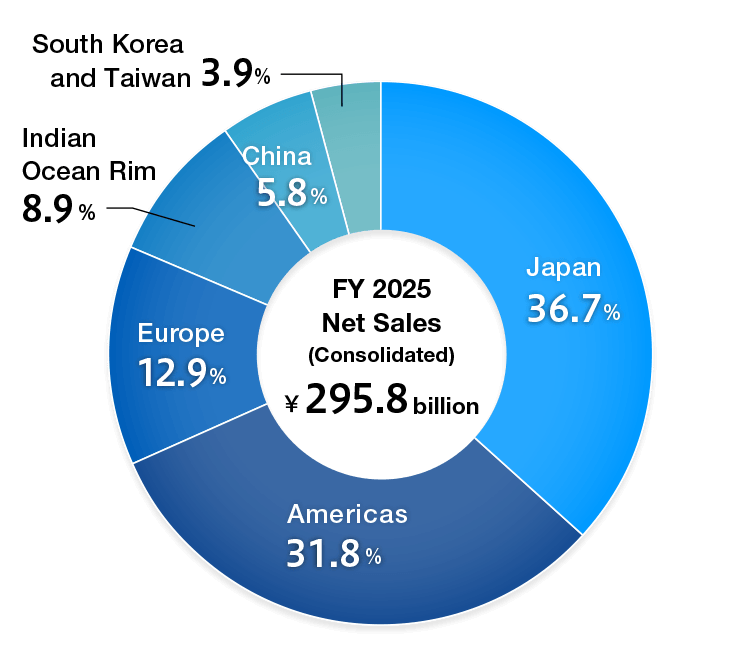
Regional Sales Breakdown